Entangled App
Entangled lets you explore the influence of your consciousness on quantum bits. It consists of a mobile app connected to quantum hardware that follows a set of rules called the Entangled Protocol. The app allows anyone in the world to join. The quantum hardware looks for consciousness effects, and the Protocol allows structured experiments and visualizations to run on the network.
Core Assumptions
Entangled is based on a few core assumptions. While controversial, they are backed by scientific evidence. References here.
1. Consciousness can influence the behavior of quantum systems
Mind-matter interaction at the quantum level is an established but poorly understood phenomenon. The effects are statistical. Examples include Princeton’s studies correlating the output of quantum RNGs with human intention and the Institute of Noetic Sciences’ experiments in remote photon influence. Cumulative results from these labs exceed chance by millions to 1, and are substantiated in meta analysis.
The mechanism of influence remains unknown. It does not necessarily involve observer effect interpretations in QM. Future developments in quantum biology, physics, Simulation theory, etc, will provide a mechanism to explain these data.
2. The subconscious is the driver
Broadly speaking, the subconscious is the agent that influences the quantum systems. No conscious effort is required. The influence is goal-directed and amplified by meaningfulness.
The Mobile App
Downloading the Entangled app and creating an account is all you need to do. This connects your account to a quantum hardware node. Every 10 minutes the hardware gives you 200 fresh bits assigned and delivered only to you.
This setup enables your subconscious mind to influence the photons, and associate the results with visualizations and experiments running on the network.
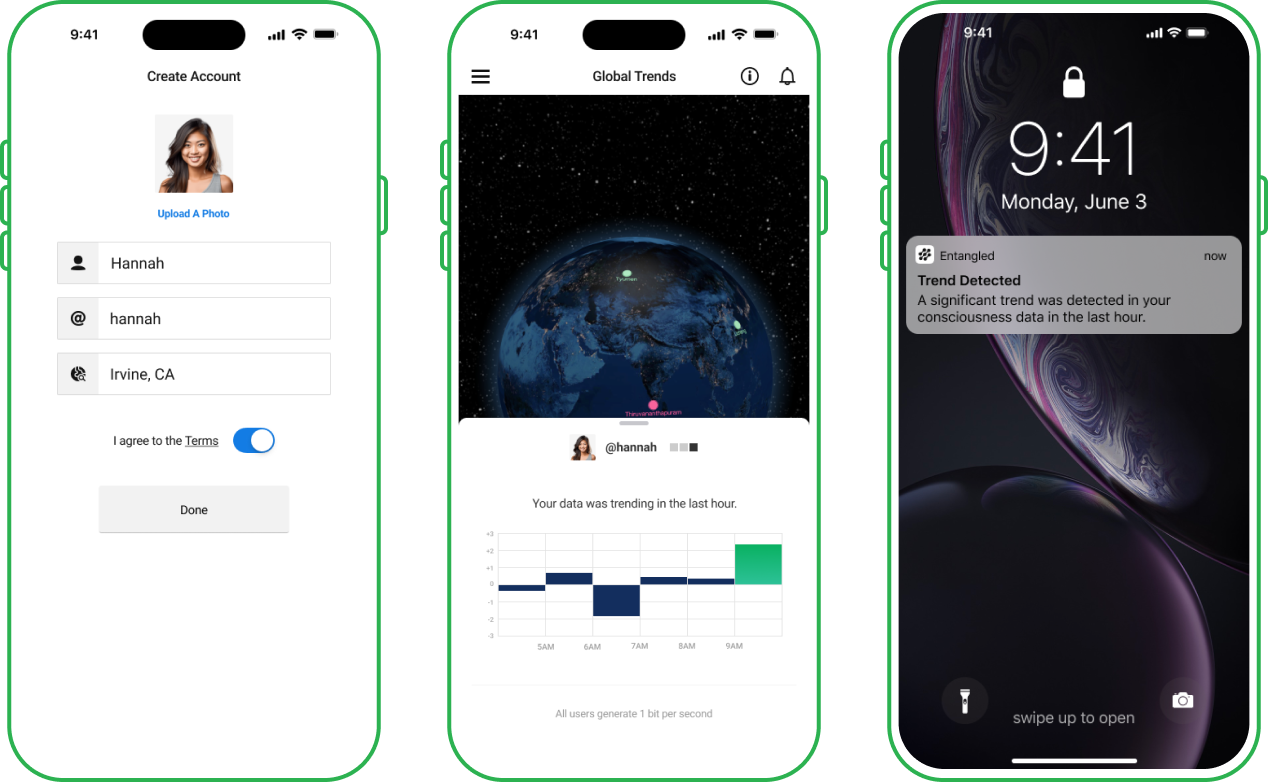
The app gives feedback on your data with charts, a globe of the cities furthest from chance, and a notification whenever your bits show a very interesting trend. You can add a note to any 10 minutes of your data and look back at what was happening.
Quantum Hardware
Consciousness effects are statistical. They are quantified by comparing observed outcomes to those expected by chance, or assessing how much a particular data sample differs from theoretical predictions.
Photons (particles of light) are perfect for this, because they follow simple principles described in quantum mechanics that provide perfect theoretical predictions against which consciousness effects can be measured.
Entangled uses specialized hardware that converts photon behavior into data, enabling the potential influence and quantification of a user’s subconscious mind.
Within each hardware node is a light source that sends photons to a beamsplitter, which is a semi-transparent mirror at a 45° angle. Each photon will either travel through the beamsplitter to a detector, or be reflected by it into a separate detector.
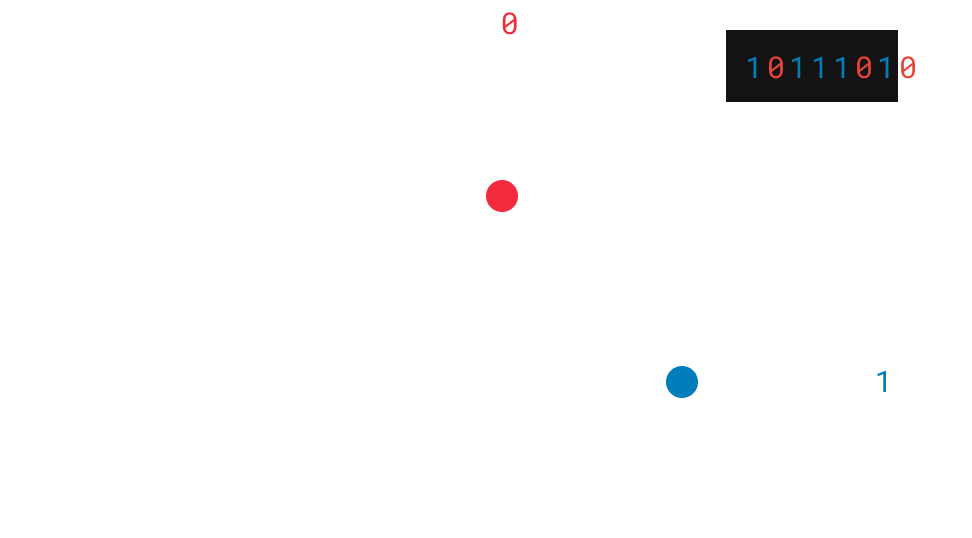
Photons are converted to bits (1 or 0) depending on which detector they reached. According to quantum optics, the path of the photon is intrinsically random. Therefore each bit has an equal probability of being a 1 or 0 (p=0.5). This greatly simplifies the statistics used to look for consciousness effects in the Entangled network.

Hardware nodes can be scaled to handle millions of photons per second. Each node passes the NIST SP800-22 compliance tests for randomness.
Your Bits
Before any bit exists, the server commits to a per-person bit allocation, and records that commitment with a cryptographic hash. Only then does the hardware read the bits, 200 bits for each person, spread over the 10 minutes. Nothing about the results can change who gets which bits.
Your 200 bits are added up. By chance alone the sum is 100 on average and typically within about 7 of it (the standard deviation is 7.07). The z-score is that distance in standard deviations: z = (sum − 100) / 7.07. A sum of 121 is z = +2.97; a sum of 93 is z = −0.99. There is nothing innately good or bad about a positive or negative z, it is just how the balance of 1s and 0s is represented.
Your 10 minutes are interesting when z is 2 or more in either direction, which for your bits means a sum of 85 or less, or 115 or more. Chance alone does that about 1 in 25 times, which is about 5.8 times a day, and the charts mark it.
They are very interesting when z is 3 or more in either direction: a sum of 78 or less, or 122 or more. Chance alone does that about 1 in 439 times, which is about once every 3 days, and you get a notification each time.
Before the bits are counted, a fixed XOR mask is applied for data integrity, guarding against bias.
City and Global visualizations pool their members’ bits and use the same two levels: interesting at z = 2 and very interesting at z = 3, in either direction. For large groups, chance alone reaches those levels about 1 in 20 and about 1 in 370 times.
Interesting results can be attributed to random chance or to the subconscious influence of users on the photons, or both. With thousands of people and 144 windows a day, chance produces interesting trends all the time. As always, correlation is not necessarily causation.